
Cyber Rescue. Human Response.
Find the threat.
Understand the risk.
Prove the control.
Security score
Holding steady
1 open incident · 2 critical vulnerabilities
Live signal feed
onwatch · continuous scan
Enumerating assets
Why this exists
Security operations and compliance keep drifting apart
Most teams run two programs with two sets of truth. OnWatch runs one.
Tools that don't talk
Detection lives in one console, risk in another, evidence in a shared drive. Nothing reconciles, so nobody trusts the number.
Audits that start from scratch
Every cycle becomes a screenshot hunt. Controls get re-tested manually because last year's proof already expired.
Risk that is a spreadsheet
Residual scores go stale the day they're written, and no failed control ever finds its way back to the register.
Two products, one graph
OnWatch SOC and OnWatch GRC are different jobs — on the same data
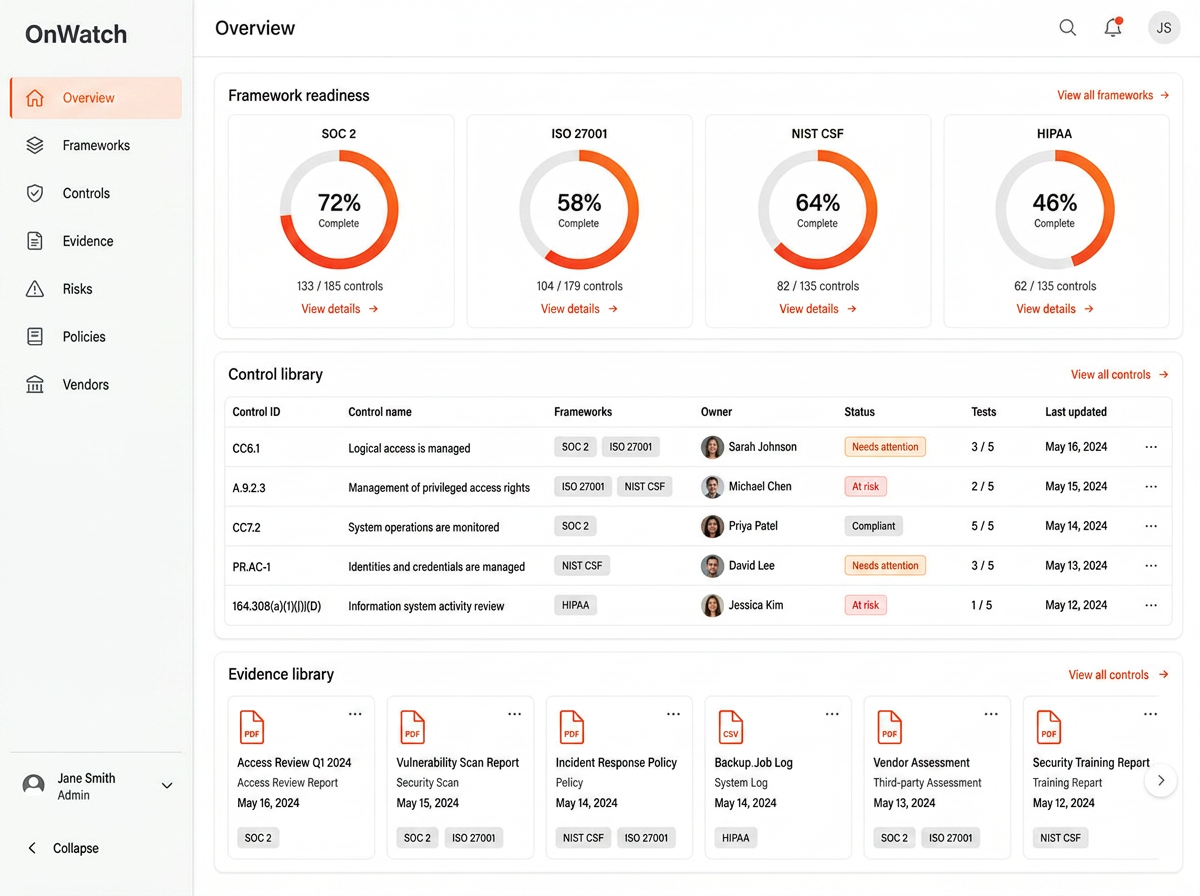
Inside OnWatch GRC
- Control library from standards
- Framework readiness
- Evidence library & expiry
- Risk register & scoring
- Policies & attestations
- Vendor risk & auditor portal
Capabilities
Everything the program needs, in one console
No bolt-on modules with their own logins. Same data, same permissions, same audit trail.
Command center scoring
One 0–100 posture score built from controls, vulnerabilities, incidents, people and third parties — with a 30-day trend.
Incident response
Alert triage into a full incident room with timeline, linked assets, containment steps and after-action evidence.
Vulnerability ticketing
Turn any finding into an assigned remediation ticket, routed only to teammates with vulnerability write access.
Controls from standards
Activate a framework and generate the control set from its actual requirements, mapped back for coverage gaps.
Evidence library
Private file storage, signed downloads, automatic expiry and nightly control-test scheduling.
Program roadmap
Initiatives bucketed into quick wins and 3, 6, 9, 12-month, 2 and 3-year horizons with owners and progress.
Vendor risk
Security reviews, questionnaires and risk tiering for the third parties inside your blast radius.
Personnel compliance
MFA, device encryption, background checks, policy acknowledgements and training in one matrix.
Auditor workspace
A read-only portal with scope, PBC requests, evidence and control status — no edit access, no email threads.
Connections
Plug into the stack you already run
Credentials are encrypted at rest, tested before they're saved, and synced on a nightly schedule.
Who it's for
One platform, three very different days
Security leaders
A defensible score, board-ready trend lines and a roadmap you can fund — instead of a slide deck rebuilt every quarter.
Practitioners
Triage, remediation and evidence in the same queue, scoped to the environment and permissions you actually hold.
Auditors and executives
Read-only access to scope, control status and evidence with a full activity trail behind every artifact.
Where the two meet
One event triggers the whole chain.
Follow a single detection end to end. Hover to hold a step, click to jump.
Alert fires
SentinelOne raises a credential-dumping detection on a production jump host. The graph resolves the endpoint to an owner, an asset class and every control that depends on it.
- ›Source: EDR telemetry
- ›Asset: prod-jump-01
- ›Elapsed: 00:00
Cyber Rescue. Human Response.
Stop reconciling. Start proving.
Bring detection, risk and evidence onto one graph — and walk into your next audit with the answers already written.